Here are two broad streams one is “.It Views” and second one is “.FAD”. We’ll study under both streams simultaneously. A parallel approach will make the learning process a little bit comparative but both the streams are different and exclusive in terms of views and their processing. A repository of views falls under “.It Views” while the “.FAD” will examine the digital microscopic views under zoom characteristics and actual configurations. The main difference between these two technologies lies in the way of view processing .It Views studies iterative transient views while .FAD focuses on digital microscopic views and two or more digital microscopic views may also transit so that observations will go under .It Views. Simply in .FAD (Digital Microscopic Views And Display Technology) we will study about digital microscopic views in terms of their design, size, actual configurations and nature of the views to explore the salient features of the views to characterize them to explain their usage in the real world. The common area in both technology is the term ‘view‘ otherwise there is nothing same. However, the ”.It Views” is an in-depth study of the iterative transient views but here we will emphasize on normal world’s views that frequently reoccurring at a certain amount of time and undeniably the views irritate human brain and demand a hard work to develop approaches to overcome from such problems of reoccurrences. The first step in this direction is to develop control strategies to reduce a view’s frequency then deployment of extra generated views. I hope that .It Views will helpful to resolve the view frequency related problems.
FORMULAE
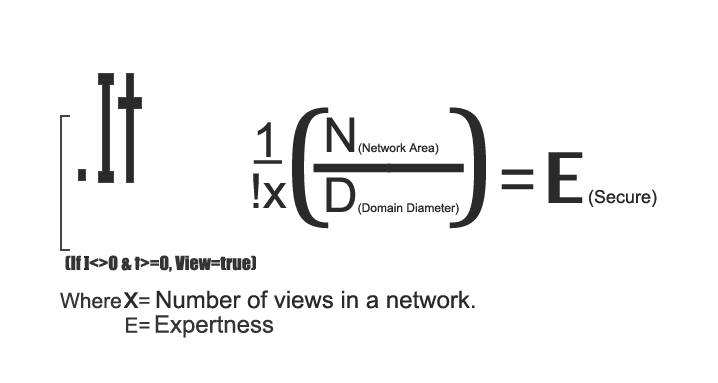
‘I’ is number of iterations of each view (Assumption: views are dynamic), ‘t’ is total number of transitions among two or more views and ‘dot’ denotes the product of ‘I’ and ‘t’ that known as first step processing while ‘[‘ shows the multiplication of the outcome value of the ‘I*t’ with an outcome of the rest processing of the formula known as second step processing where ‘x’ is number of views in a network and multiplication of both the outcome values known as third step processing while the result of the third step processing will be united with percent to express the percentile of the secured expertness that is percentage of the expert views (The views successfully migrated from a domain to the network and different from pre-existing views in the network) reflecting in the network from a domain in a secure manner. There must at least one iteration to occur a view or become a view true while transitions may equal to zero if more than zero transitions that means the view being change on time scale because each transition takes time and ‘.It Views’ is based on the study of the changing view/s due to transitions. Here N is network area the distance between two distant nodes in meters/ kilometers and D is domain diameter in meters/ kilometers. There may atleast one or more domains within a network in case of more than one domain the values of their diameters will add in other words the ‘Network Area’ should greater or equal to ‘Domain Diameter’ (N>=D). Here we assumed a network as an arbitrary distribution of the connected nodes and domain as a ring or circular dispersement of recognised and validated views.
My tweets on .It Views (An Ethofolio of Technology)
